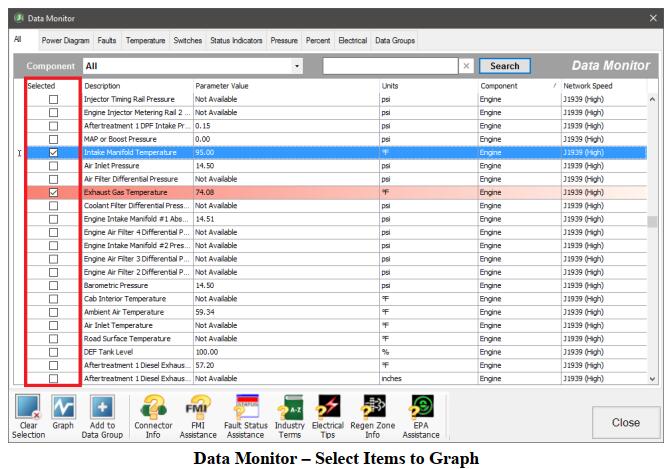
JPRO Commercial Vehicle Graph window displays various data items and parameters in a constantly updating graph format, allowing you to view trending information. The graph is configured and launched from the Data Monitor.
What You Need?
2023 JPRO Commercial Vehicle Diagnostics
Noregon JPRO DLA+ 2.0 Adapter Kit
1.Select data rows of interest in the Data Monitor by clicking the Selected checkbox. You may clear any previously selected rows by selecting the Clear Selection button.
2.Click on the Graph button.
3.The Graph window is displayed. The data items you selected will be plotted on the graph over time.
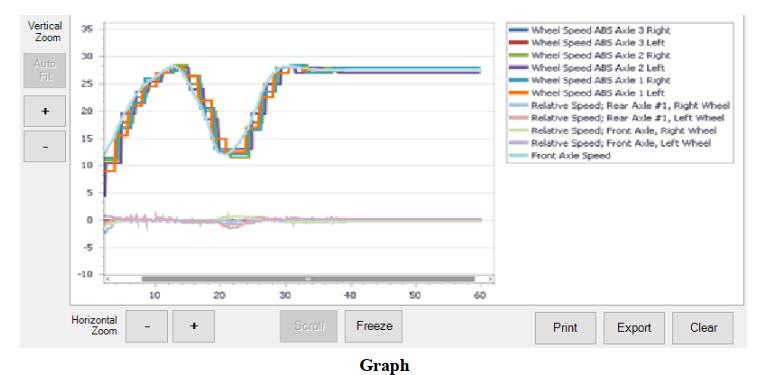
4.To customize the display:
a.Hover the cursor over the graph to see the value plotted.
b.You can zoom each axis of the graph independently by clicking either the + or – button.
c.Clicking the Auto Fit button will resize the graph to show all plotted data items.
d.The Scroll button automatically moves the graph view to the most current information.
e.The Freeze button allows you to keep the graph view from moving, letting you easily study the data while the graph continues to run.
f.Print allows you to print the current graph view. A color printer is strongly recommended.
g.Export displays a save file dialog. Up to the last 5 minutes of currently graphed data can be saved to the desired location as an XML file.
h.The Clear button removes all data from the graph and begins capturing new data.